![]()
People are saying good things!
"What I like most is the transparency." Jon, UK
"The dynamics automation saves hours of editing!" Luke, Canada
"...producing music is much more enjoyable with a sanity checker like SpecTrend!" Alexander, UK
SpecTrend™ Help/Manual
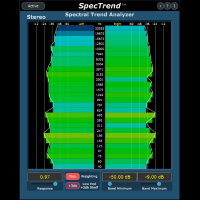
SpecTrend™ - Spectral Trend Analyzer
SpecTrend™ is a Spectral Trend Analyzer. More than just a spectrum analyzer, SpecTrend™ shows you the ongoing RMS spectral content of your track, or mix, referenced against a Pink noise spectrum! This allows you to easily see the spectral balance of your mix, since all frequency bands will show at the same level when balanced.
Note: SpecTrend's main function is to visually display your signal referenced to pink noise, which is done mathematically. It does not introduce any noise.
A good mix will have a spectral content that closely follows the spectral distribution of Pink noise , decreasing at -3db per octave. SpecTrend™ shows you visually, with both 1/3 octave bars and color coding, how your mix is spectrally balanced. This allows you to easily adjust levels and apply EQ with confidence.
Pro Tip: The spectral balance can even help with arranging, since you will be able to see which frequency bands are available to add another part!
Suggestion: Try playing the best sounding mixes you know through SpecTrend™. You will see that the best mixes are those closely matching the Pink noise spectrum. They will show all frequency bands at the same level. with perhaps occasional peaks during solos, or accent parts, etc..
Spectral Trend Meter
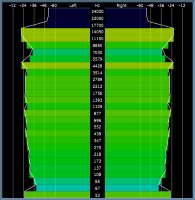
The Spectral Trend meter displays the RMS level of each 1/3 octave band. The bars are color coded according to level and desired range, with green representing the target range. Higher levels will display as yellow, then orange, and finally red for the highest levels. Lower levels display going to blue and fading away. The range is controlled by the Spectral Band Controls (see below). The speed at which the bars integrate the ongoing RMS value of each bar is controlled by the Response Control (see below). The center frequency (in Hz) of each bar is shown running from lowest to highest from bottom to the top of the meter. If you click anywhere in the column of numbers, it will show the upper limit of each band. Click again to return to the center frequency.
Clicking anywhere on the spectrum bar display will freeze the spectrum display. Clicking again will un-freeze the spectrum display.
A white line connects the upper limit of each bar to help indicate when all bars are at the desired level. For the default Pink Noise reference, you will want to have the white indicator line, and the bars, show as close as possible to a rectangle.
The vertical background lines are at -12db, -24db, -36db, -48db, and -60db starting at the far left or right, respectively. They provide a useful reference for comparing bar levels.
It should be noted that frequency, displayed in the center column, shows the upper limit for each 1/3 octave band. And, above 17kHz, the band values represent the Nyquist frequency for their respective sample rates.

Response Control
The Response control allows you to set how fast the Spectral Trend Meter integrates the RMS values to display. In many cases, the default speed will work well, but you can optionally change this value depending on your needs. The value can be entered manually or adjusted with the slider.
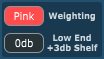
Weighting Button
The Weighting button allows you to enable or disable the pink noise spectrum weighting of the display. When enabled (the default), the display is compensated to show all bands at an equal level as the input signal follows a pink noise (1/f) slope. So, if you actually input pink noise to the display, it will show as all bands being equal.
When disabled, the display shows a normal 1/3 octave spectrum
The Low End +3db Shelf button modifies the spectrum display, below 150Hz, to permit 3db increase relative to a normal pink noise weighting.
Note: for testing purposes and reference, you can inject pink noise with the builtin noise generator (see below).
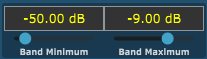
Spectral Band Controls
The Spectral Band controls allow you to set the upper and lower limits for the display. This control allows you to fine tune the frequency bands to display your desired range. So, by varying the upper and lower limit, you can postion the target "green" indication to the levels you require. In many cases, the default values will provide a balanced signal at good levels. The value can be entered manually or adjusted with the slider.
Track Color/Name Bar
The Track Color/Name bar, which is located at the bottom of the plugin, will display the track name and/or the track color, if your DAW supports this feature. If your DAW does not support this feature, the space will be blank and appear as the plugin's normal background.
For example, currently, Pro Tools supports the track name, but not the color.
Bypass Button
The Bypass button allows you to enable or disable the plugin.
Size Button
The Size button allows you to enlarge, or reduce, the plugin's size to accomodate high DPI displays.
Help Button
The Help button display information about the plugin and its features.
Information Button
The Information button gives information on both the plugin and your computer. It includes the information that will allow you to contact us by email.
Note that we will respond to emails during regular business hours. We appreciate your patience and understanding.